Hi,
I am curious if there is a way to generate a color map display for a human brain representing the mean cortical thickness of a group. I have attached two images as examples of what I would like to generate. I don't know whether it is possible, an earlier post from Christian Gaser suggests that it cannot be estimated using CAT12 (https://www.jiscmail.ac.uk/cgi-bin/webadmin?A2=SPM;ab33665f.1708). I also feel like the Zhuang_2017 image might just be a display of the t-maps or beta-maps and not represent actual thickness. Any help would be appreciated.
Narr_2005 is figure 1 from:
Narr, K.L., Toga, A.W., Szeszko, P., Thompson, P.M., Woods, R.P., Robinson, D., Sevy, S., Wang, Y., Schrock, K. and Bilder, R.M., 2005. Cortical thinning in cingulate and occipital cortices in first episode schizophrenia. Biological psychiatry, 58(1), pp.32-40. (http://www.sciencedirect.com/science/article/pii/S0006322305004294?via%3Dihub)
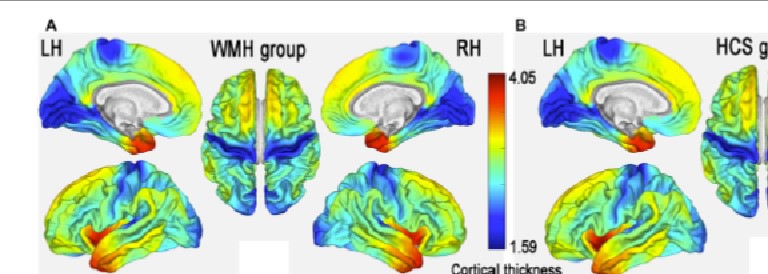
Zhuang_2017 is figure 2 from:
Zhuang, Y., Zeng, X., Wang, B., Huang, M., Gong, H. and Zhou, F., 2017. Cortical Surface Thickness in the Middle-Aged Brain with White Matter Hyperintense Lesions. Frontiers in aging neuroscience, 9. (http://journal.frontiersin.org/article/10.3389/fnagi.2017.00225/full)
Thanks,
Travis
|


