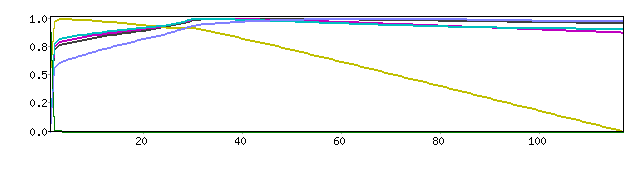
This looks OK to me... not sure what you mean by discontinuities...  could it be that you're worries about the 2nd peak (at about 30)? This is induced by the EIgenspectrum (green curve) which shows a very steep drop early on and an unusual (but smaller) drop at the second peak. Dependent on the form of the penality term this second drop is or is not sufficient to estimate a higher dimensionality...
hth
Christian


On 10 Dec 2009, at 13:57, Kundu, Prantik (NIH/NIMH) [F] wrote:

> Nope, this isnt simulated data. What do you mean by dimension of the data? There are about 6000 input timecourses at 196 timepoints each.
> ________________________________________
> From: Christian F. Beckmann [[log in to unmask]]
> Sent: Thursday, December 10, 2009 8:40 AM
> To: [log in to unmask]
> Subject: Re: discontinuities in ppca eigenspectrum
>
> Hi
>
> Not sure what you mean - can you send the plot? Also, what's the dimension of the data and is this simulated data?
> cheers
> christian
>
>
> On 10 Dec 2009, at 12:12, Kundu, Prantik (NIH/NIMH) [F] wrote:
>
>> Hi Steve and Christian (and others)
>>
>> Hope you're well. When I run melodic (with minimal manipulation,  via cmd line) on a dataset with only 3 axial slices I get an PPCA eigenspectrum with sharp discontinuities in the curve. What could this mean? The explained_variance curve looks normal (no discontinuities)
>>
>> -Prantik
> <melodic_PPCA>
|


