Hi all,
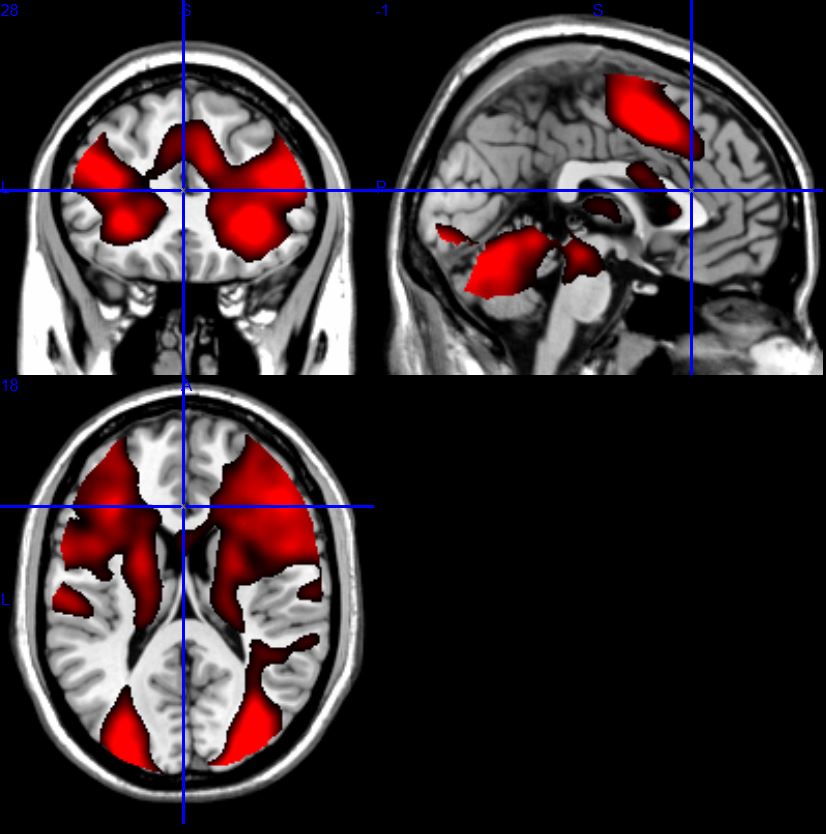
We have preprocessed our data using standard procedures - slice time, realign, normalisation with EPI template, smooth. Group level statistics have generated t-maps that show an almost mirror image effect between the activation patterns across the two hemispheres. Attached is a screen shot of a t-map (all subjects in a single condition) opened in mricron at a very low threshold (the effect holds at higher thresholds). We saw the same effect when we opened the t-map in SPM itself.
Does anyone have any thoughts on this?
- Amri
|


