Dear FSL experts,
I am trying to analyse a treatment intervention study using TBSS. I am relatively new to TBSS and randomise and would appreciate any guidance. I have searched the FSL help exhaustively and have run some analysis, but I am still a little unsure if I am doing it correctly. I hope someone might be able to help?
Background about the subjects:
Treated group n = 9, scanned 12 weeks apart with exercise intervention = 18 FA maps
Waitlist group n = 7, scanned 12 weeks apart with no exercise intervention = 14 FA maps
I'll focus on the Treated group for this example.
The naming convention I chose is as follows and this is how they were entered into the design matrix. Where TXT_1_xxx is time 1 and TXT_2_xxx is time 2 (12 week interval).
TXT_1_ET01_DTI_FA
TXT_1_ET02_DTI_FA
TXT_1_ET03_DTI_FA
TXT_1_ET04_DTI_FA
TXT_1_ET05_DTI_FA
TXT_1_ET08_DTI_FA
TXT_1_ET17_DTI_FA
TXT_1_ET18_DTI_FA
TXT_1_ET19_DTI_FA
TXT_2_ET01_DTI_FA
TXT_2_ET02_DTI_FA
TXT_2_ET03_DTI_FA
TXT_2_ET04_DTI_FA
TXT_2_ET05_DTI_FA
TXT_2_ET08_DTI_FA
TXT_2_ET17_DTI_FA
TXT_2_ET18_DTI_FA
TXT_2_ET19_DTI_FA
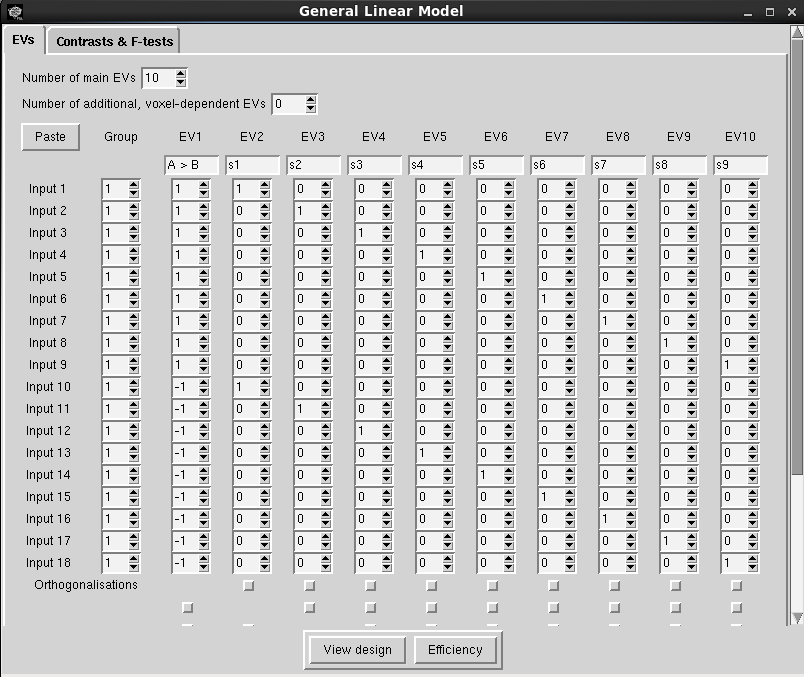
I am interested in the effect of treatment and would like to use a paired t-test. I have attached my design matrix and contrasts to this message. Can someone tell me if I am on the right track (forgive the naive question)? Input 1-9 are time 1 and Input 10-18 are time two, maintaining the same order. Is this set up correctly? And ultimately I am interested in the change in FA, so the pertinent contrast would be C2?
Any help would be greatly appreciated.
Many thanks,
Jovanka
|


