Hi all -- I was wondering if someone could help me interpret the results from
a recent 2 x 2 repeated measures ANOVA I ran...
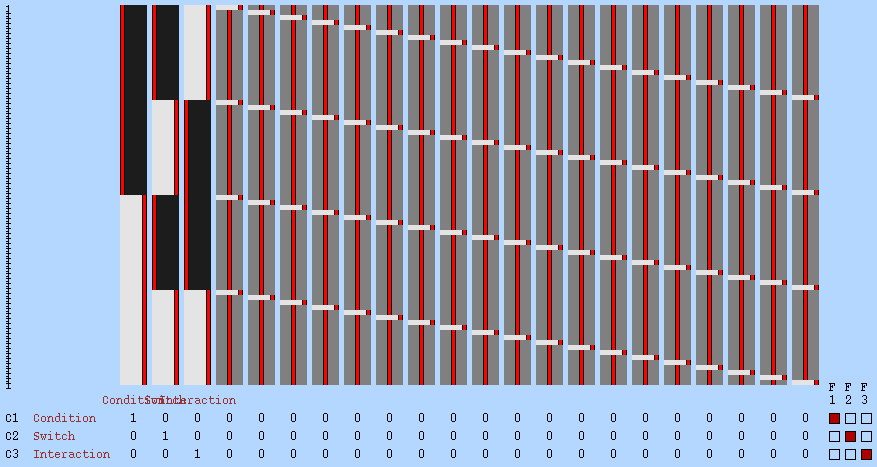
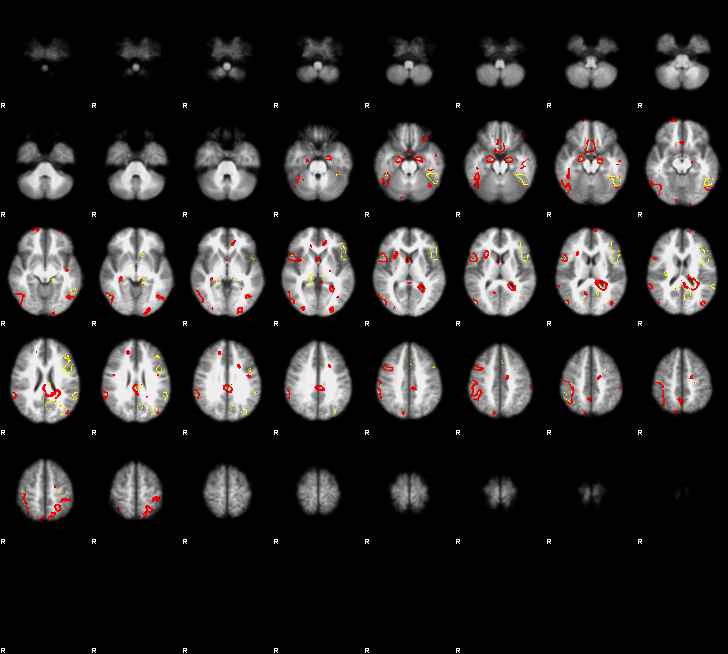
Attached is the design image and an example of a resultant fzstat overlay
that I'm a little confused by. (I apologize for the quality of the fzstat,
had to reduce quality to fit in this message)
Does anyone know why I might be getting this type of "outlining" in the
fzstat image? The contrasts of each level and the interaction look fine
(normal clusters) but
all 3 of my fstats look like outlines of clusters...
I opened the fzstat map in fslview and played with the thresholds...it fills
the clusters in a little to drop the minimum threshold and increase the
maximum, but some voxels have odd values, like '-inf' for example.
Thanks!
~Jon
|


