 |
Dear Thierry,
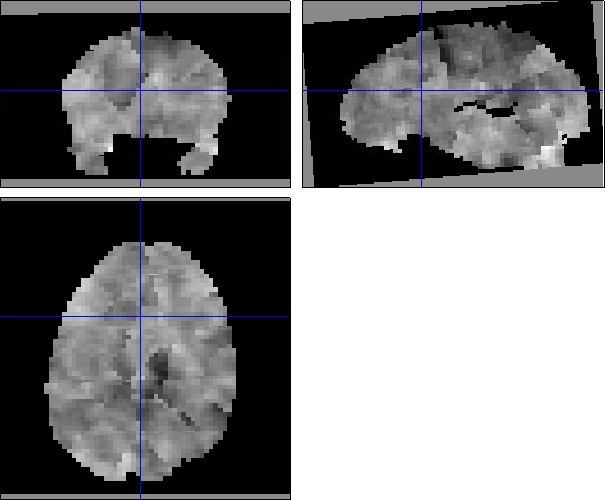
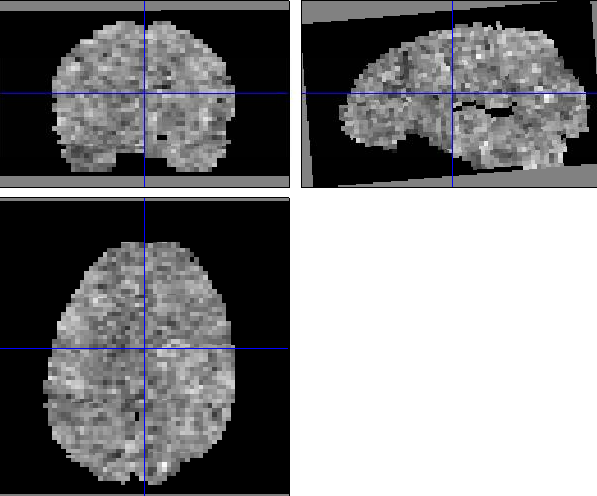
Here SPM has a Weighted Graph Laplacian (WGL) spatial prior over each regression coefficient with a different inferred level of smoothness for each. I see from the images that beta1 is also much smoother than beta3. Are there very different numbers of events
in columns 1 versus 3 ?
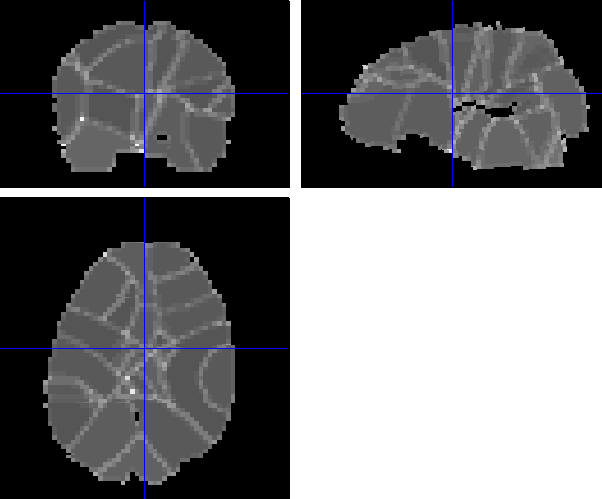
You've also used the subvolumes option - so that the algorithm is applied separately to each subvolume, as described in
http://www.fil.ion.ucl.ac.uk/~wpenny/publications/graph08.pdf
So the combination of being very smooth and having subvolumes gives you these large edge effects. I don't think there's an error in processing however - this is what the algorithm does. The only thing that concerns me are the large values in the SD_beta1 images - am not entirely sure of the origin of this. It could be that the SD is just larger at the edges because there are fewer voxels to base estimates on (in combination with a small number of events ?). Whatever the origin, this will introduce noise into your MVPA (i know the SD's don't enter directly, but its a sign that betas have not been estimated well).
So perhaps its best to not choose the subvolumes/WGL combination here and just go with unweighted (U)GL (WGL would take a very long time on the whole brain as a single volume).
Best,
Will.
Gilron, R., Rosenblatt, J.D., Mukamel, R., 2016. Addressing the ‘problem’ of Temporal Correlations in MVPA Analysis. Proceeding of the In: Proceedings of the 6th International Workshop on Pattern Recognition in Neuroimaging.