Hi SPM-DCMers
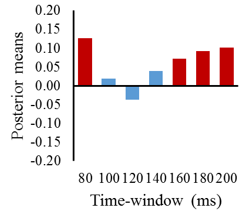
I am using DCM for ERP to look at the inter-regional connections. To get the gradual changes of these connection strength, several time-windows that start from stimulus onset were choosen in the data analysis, they are 0-80, 0-100, 0-120, 0-140, 0-160, 0-180, 0-200 time-windows. Now some results came out, see one figure. In the figure, a positive value denotes a stronger connection for A condition than for B condition in the connection and vice versa. As we can see, the connection is stronger for A at 0-80 window, but the pattern disappears at the following three windows, but then the pattern emerges again.