Hi Cyril and Mike,

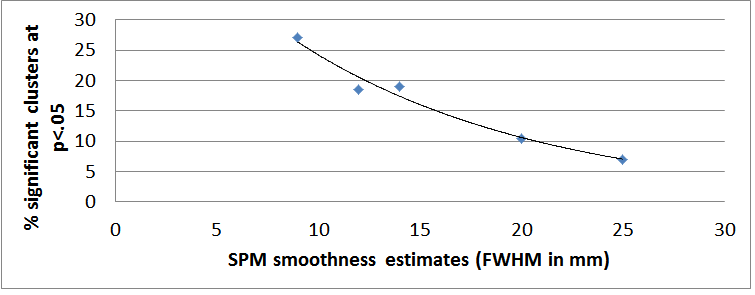
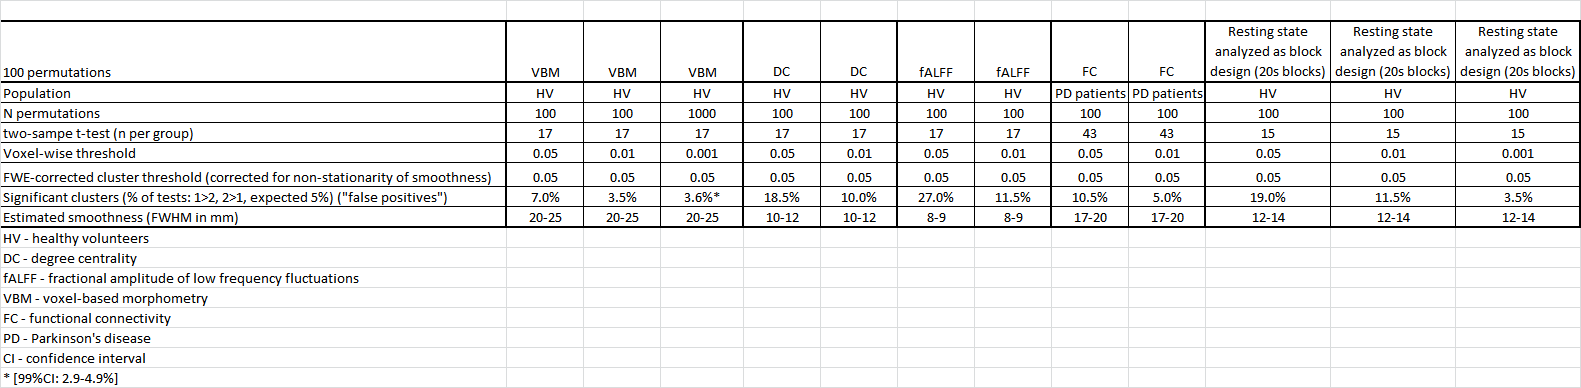
yes and no (to Cyrils question), as you can see from the figure in my previous email, some data already seem to converge to an appropriate correction already at a liberal voxel-wise thresholds (p<.01 and even p<.05 for VBM for HC for example and the same for functional connectivity in PD patients in our data set) and some do not. In contrast, you can also see that for VBM in our data p<.001 resulted in a significantly over-conservative correction (which is not as problematic but also indicates that the correction in general is not very accurate being only correct for a specific p-value range). Correspondingly, these general statements on what is okay and not okay are kind of overgeneralized and need to be empirically determined for the specific data. What seems definitely correct, is that the cluster threshold behaves quite different and inaccurate depending on the data and it seems to be highly dependent on smoothness (below also a figure on this). Basically, the only way to have general validity would be really to go to a non-parametric approach as recommended by Eklund or to determine the validity of a specific parametric cluster and voxel-wise combination empirically as for example for the data in my table (which becomes a kind of mix between both - non-parametric cluster threshold on parametric voxel-wise data. Considering that an approach like the one used to create the table or a fully non-parametric one as by Eklund et al. provide a valid empiric null distribution for any voxel-wise threshold, not sure why one would want to go forward with a cluster threshold which one never knows if it is currently correct, over- or under-conservative).

Regarding Figure 1 in Friston et al., yes, it says that low CDT is a bad idea because it OVERESTIMATES the expected cluster size (which should lead to an over conservative correction). In contrast, Eklund et al. show that it UNDERESTIMATES it. So, yes, low CDT is a bad idea but for the opposite reason than in this figure therefore an argumentation with reference to this figures appears problematic. Actually, the caption of the figure 1 also says that smoothness does not matter (in contrast it seems to matter very strongly).

Inline-Bild 2

Best wishes,

Juergen

2016-07-26 23:55 GMT+02:00 PERNET Cyril <[log in to unmask]>:

Hi Juergen,


I would argue that in general, low CDT is going to be a bad idea unless using non parametric methods to find the right threshold for your blobs. This is what I read from Figure 1. with low CDT you have high E(n). 


--
Dr Cyril Pernet,
Senior Academic Fellow, Neuroimaging Sciences
Centre for Clinical Brain Sciences (CCBS)

The University of Edinburgh
Chancellor's Building, Room GU426D
49 Little France Crescent
Edinburgh EH16 4SB
[log in to unmask]
http://www.sbirc.ed.ac.uk/cyril
http://www.ed.ac.uk/edinburgh-imaging


From: SPM (Statistical Parametric Mapping) <[log in to unmask]> on behalf of Juergen Dukart <[log in to unmask]>
Sent: 25 July 2016 12:36:45
To: [log in to unmask]
Subject: Re: [SPM] cluster failure article
 
Dear all,

to follow-up on this discussion.
1. First of all, it is important to note that the PNAS publication is showing an underestimation of the expected cluster-size in the context of fMRI analyses and cannot be extrapolated without cautiousness to any kinds of results. More specifically the validity of a specific voxel- and cluster-wise threshold needs to be established depending on the data. I just run a simulation computing the "false positives" (not truly false positives as the data used are real data with real signal so rather overestimating the true false positive rate) for parametric cluster significance by randomly permuting different group data for two-sample t-tests for the different thresholds with various data sets we have and added here the table showing that the validity is highly data and smoothness specific:
Inline-Bild 2

2. How does the Figure 1 in Friston 1994 referred to by Guillaume and Cyril anyhow predicts the results by Eklund et al. If I understand correctly, the referred Figure 1 and the corresponding text in Friston et al., say that the corresponding equation substantially overestimates the expected cluster size at lower thresholds. Is it not exactly the opposite of what Eklund shows?

Thank you very much for your feedback.

Best wishes,

Juergen


2016-07-11 10:48 GMT+02:00 Guillaume Flandin <[log in to unmask]>:
Dear Mike,

Thanks for asking. We recently wrote a short comment on a preprint
version of this PNAS article by Eklund et al, and it is available here:
  http://arxiv.org/abs/1606.08199

The conclusion reads:
> The results of these analyses [...] show that the random field theory
> provides valid inference based on spatial extent, provided its
> distributional assumptions are not violated (through the use of low
> cluster forming thresholds or smoothing).

SPM implements topological FDR:
  http://dx.doi.org/10.1016/j.neuroimage.2008.05.021
  http://dx.doi.org/10.1016/j.neuroimage.2009.10.090
that uses results from the random field theory and therefore relies on
the same assumptions.

Best regards,
Guillaume.


On 11/07/16 09:22, Mike wrote:
> Hi SPM experts,
>
> Does anyone notice a recent article in PNAS: "Cluster failure: Why fMRI inferences for spatial extent have inflated false-positive rates" by Eklund et al.? Although they analyzed resting-state data and I have no much idea about cluster inference, I wonder if the default parametric methods in SPM (such as FWE, FDR) are not reliable?
>
> Thanks. Mike
>

--
Guillaume Flandin, PhD
Wellcome Trust Centre for Neuroimaging
University College London
12 Queen Square
London WC1N 3BG


The University of Edinburgh is a charitable body, registered in
Scotland, with registration number SC005336.