Hi all,
For fun, I have been playing with segment analysis in Popayan, Colombia. I have been getting what appears to be contradictory information from segment and axial analysis, and would appreciate if anyone could help me interpret the distinctions.
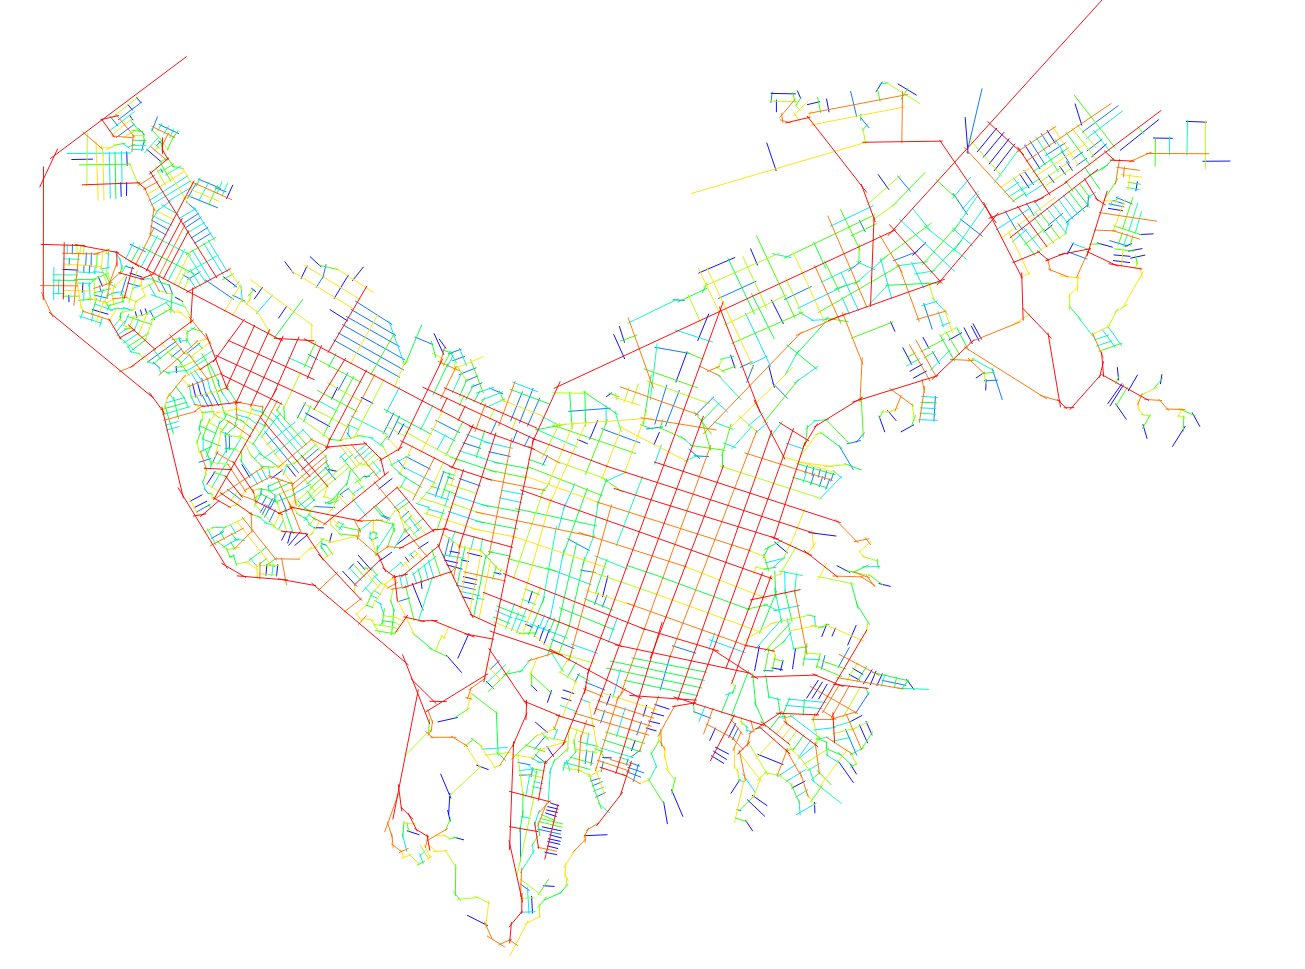
Here is the traditional axial analysis, r=3:
As one would expect, major avenues crossing the city are highlighted, as well as gridded areas. For a sense of scale, the blocks in the central area are about 100m on a side, which is a walkable size. Here you get scenes at best like
[log in to unmask],-76.606911,3a,75y,204.19h,86.46t/data=!3m7!1e1!3m5!1s_LRsi19N_QPzshRjuuOVpA!2e0!6s%2F%2Fgeo3.ggpht.com%2Fcbk%3Fpanoid%3D_LRsi19N_QPzshRjuuOVpA%26output%3Dthumbnail%26cb_client%3Dmaps_sv.tactile.gps%26thumb%3D2%26w%3D100%26h%3D80%26yaw%3D114.30283%26pitch%3D0!7i13312!8i6656!4m2!3m1!1s0x8e3002f053b32a71:0x273c7502c8ff204f!6m1!1e1">this.
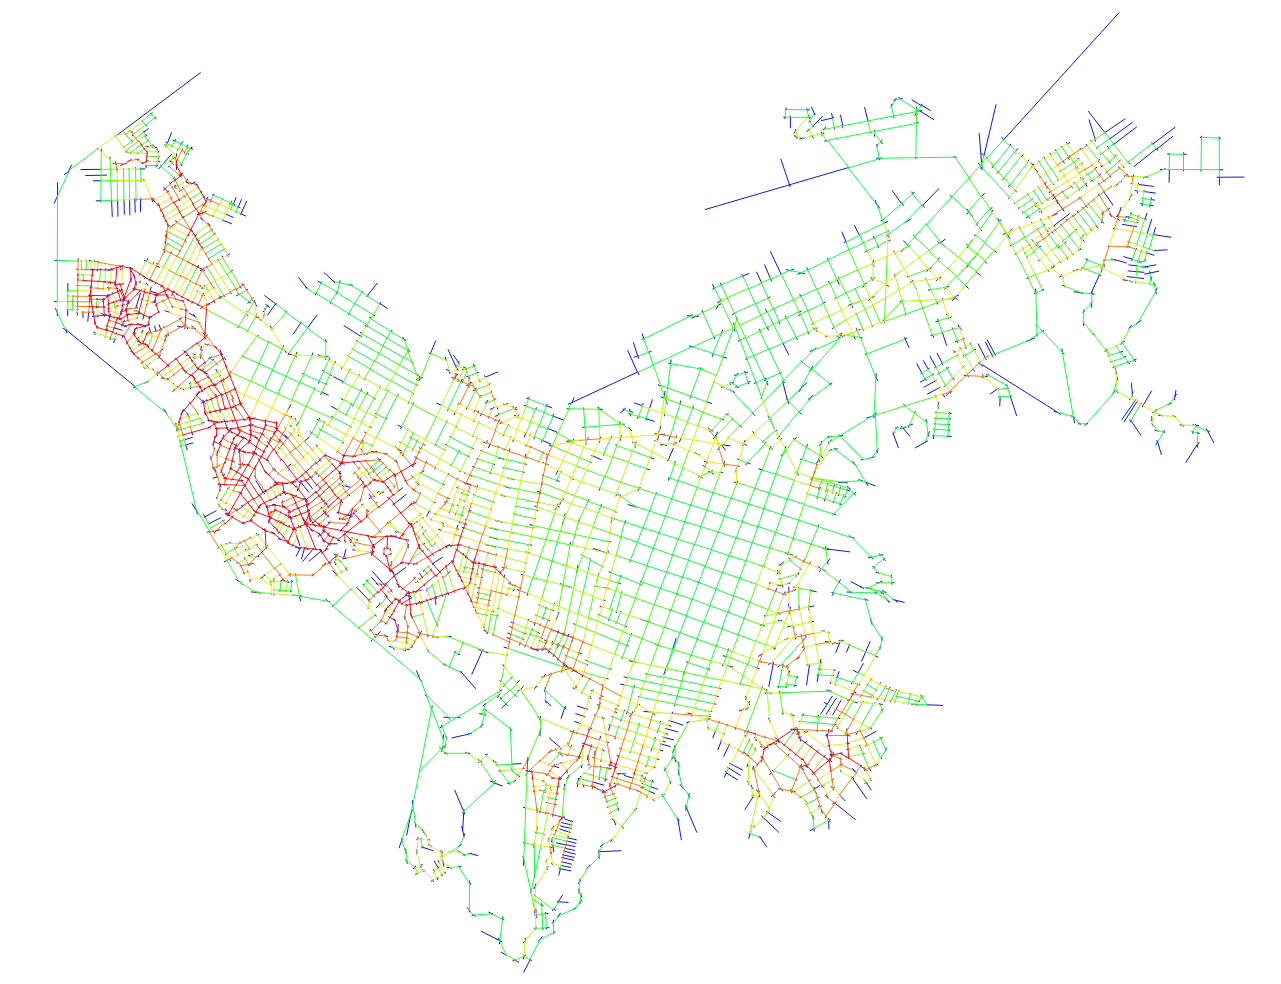
When we look at the segment analysis, however, we get a picture like this (400m choice - a good walkable distance):
This shows the southwest as the most highlighted area. This is very dense with roads, but is a poorer, more shoddy area. It is hilly, but let's ignore that for now and just look at the depthmap.
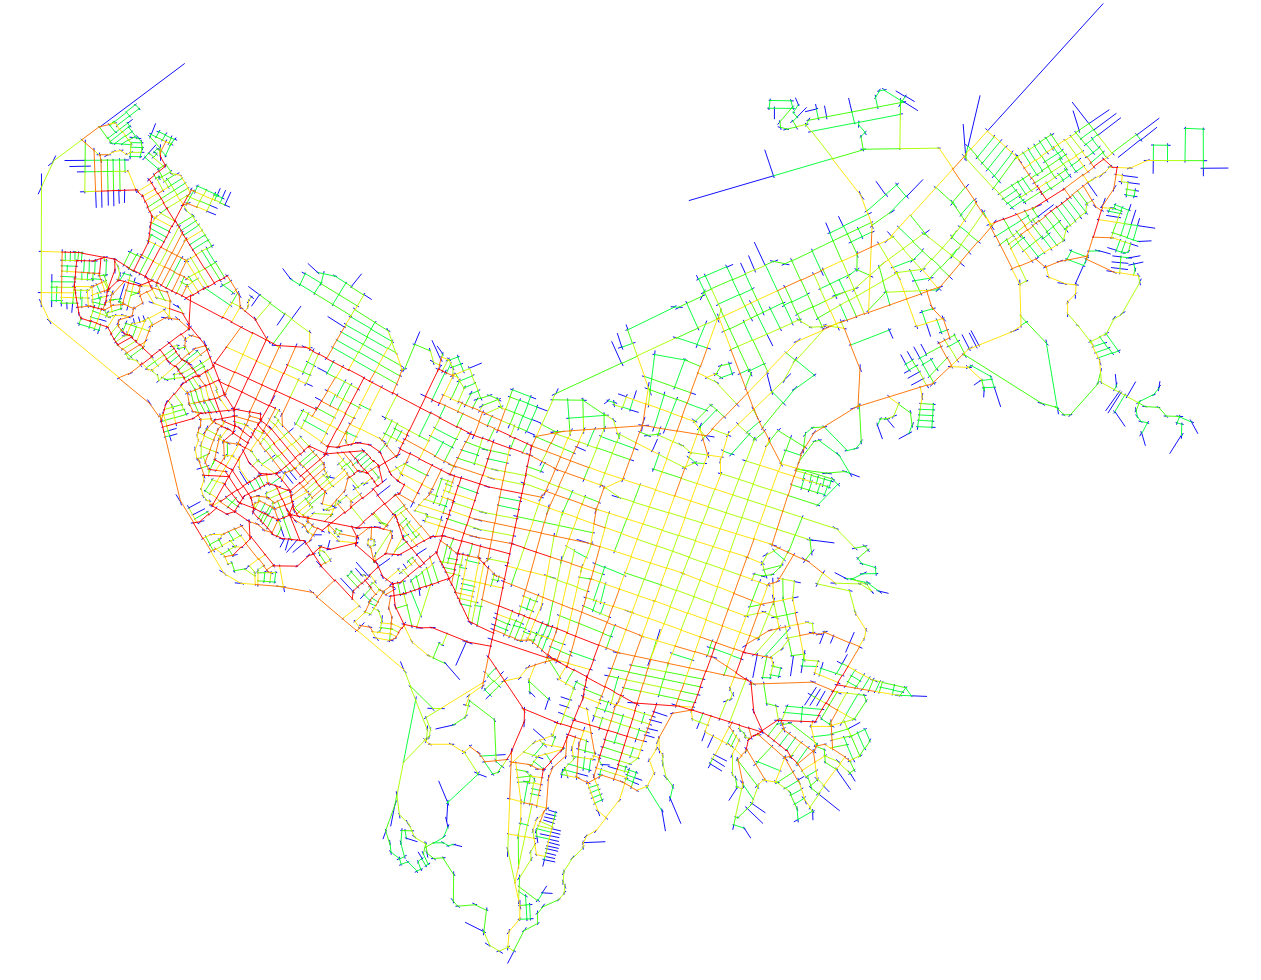
Finally, at 1200m choice, we get:
Which again highlights the SW area, though it starts to acknowledge the arterial roads of the city, but still discounts the central historic grid.
At 5000m the central district lights up again, but that isn't really a walkable distance, so isn't as interesting.
So, what's going on here? Is the southwest area secretly the area that, if it got investment, would take off? Is the central historic district not actually a good district? Am I doing something wrong? Is there some reason that Axial makes more sense as an analysis in this city? Is there something different going on in informal settlements?
Thank you everybody!
Josh