Dear Kushal,
It doesn’t look like your model is fitting very well. If you would like a number on this, load one of your models into the workspace and run: spm_dcm_fmri_check(DCM). This will tell you the explained variance
(collapsed across regions).
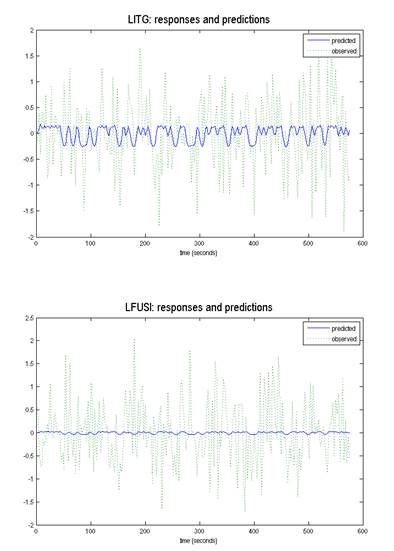
So the question then is why your model isn’t fitting well. Regarding the data going into the DCM. You have already shown that the VOIs capture a good percentage of the available signal. However, I notice in your
second region (“LFUSI”), the explained variance of the VOI is 100%, which is a little suspicious - did you forget to correct for your effects of interest f-contrast?
Best,
P
From: Kapse, Kushal Janardan [mailto:[log in to unmask]]
Sent: 20 January 2015 21:35
To: Zeidman, Peter; [log in to unmask]
Subject: RE: DCM users
Hi Peter,
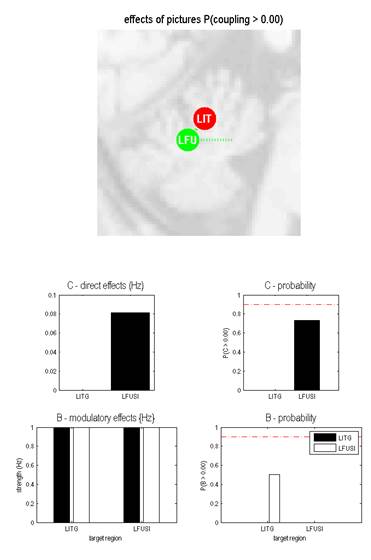
I have a question about B probability across following two models.
Basic info:
SPM8 DCM8
Bilinear, two state, no-stochastic, mean center input.
%variance of VOI:
LITG=66.3194
LFUSI=100
Best fit model= Model-1
Question:
I observe many times for many of the models I define B probability is always at 0.5. I tried to reduce the model space to only two VOI’s as below, but the B probability still stays 0.5. I am concerned
why does this happen? Is there a reason from model fitting perspective which makes it close to 0.5 or is there something I am missing in DCM model specification which affects the B probability. I initially started my model space with n=8 VOI’s and now finally
reduced to only two VOI’s, but this problem still exists.
Can you please shed some light on the following issue. I have mentioned the snapshots of effect of pictures (pictures= experimental condition) and outputs of each VOI predicted/observed.
Thanks
Kushal
Model-1: perturbation=LITG, contextual input=LITG to LFUSI

Model-2: perturbation=LFUSI, contextual input=LFUSI TO LITG

From: Zeidman, Peter [mailto:[log in to unmask]]
Sent: Wednesday, November 19, 2014 1:17 PM
To: Kapse, Kushal Janardan; [log in to unmask]
Subject: RE: DCM users
Hi Kushal,
I can’t give you an exact number on this - but most look normal to me. For those which are down in the 40-50% range, it could be that there are two or more processes going on in those VOIs, in which case your
first eigenvariate would only capture one of them. If you are concerned about any regions in particular, perhaps you could more tightly constrain them – either anatomically, or by functional activations in your GLM. I note you choose your voxels based on t-scores
– I would suggest only including regions which pass some statistical test, even if that’s only at the group level.
See my other comments below on simplifying your model and using SPM12.
Best,
Peter.
From: Kapse, Kushal Janardan [mailto:[log in to unmask]]
Sent: 17 November 2014 21:38
To: Zeidman, Peter; [log in to unmask]
Subject: RE: DCM users
Hi Peter,
I did as per your instruction to understand variance % for each VOI. Following are my numbers
Region % variance
Subject-1
Reg-A 42
Reg-B 44
Reg-C 48
Reg-D 62
Reg-E 66
Reg-F 74
Subject-2
Reg-A 70
Reg-B 61
Reg-C 65
Reg-D 72
Reg-E 56
Reg-F 54
Subject-3
Reg-A 54
Reg-B 51
Reg-C 42
Reg-D 70
Reg-E 45
Reg-F 46
Subject-4
Reg-A 53
Reg-B 57
Reg-C 53
Reg-D 66
Reg-E 45
Reg-F 54
*all the % values are rounded to nearest whole number
I was wondering how much variance should i expect or keep as minimum value for a given subject or region. If you can give your insight on this, that would be helpful
Thanks
Kushal J Kapse
Aphasia Research Laboratory
Boston University
From: Zeidman, Peter [[log in to unmask]]
Sent: Wednesday, October 08, 2014 1:24 PM
To: Kapse, Kushal Janardan; [log in to unmask]
Subject: RE: DCM users
Thanks Kushal. Ok, so three suggestions:
1. I’d look at whether any of your VOIs are only poorly capturing the data. Go through each VOI in turn, and check the explained variance percentage. To calculate this, go to the directory containing your VOIs
and for each VOI type:
load VOI_xxx.mat;
100*xY.s(1)/sum(xY.s)
And let us know the numbers for each? Hopefully, all of your VOIs are capturing a reasonable percentage of the data.
2. If the above doesn’t give insight, try simplifying your model. Start with fewer regions and fewer connections. Get it working, then build up to your full model.
3. Use SPM8 for your preprocessing and GLM, and use SPM12 (released last week) for your DCM. It’s perfectly reasonable, given the big changes in DCM, to use the two pieces of software together in this way.
Best,
Peter.
From: Kapse, Kushal Janardan [mailto:[log in to unmask]]
Sent: 08 October 2014 18:13
To: Zeidman, Peter; [log in to unmask]
Subject: RE: DCM users
Sure, Thanks Peter. Following are my responses to your questions
Dear Kushal,
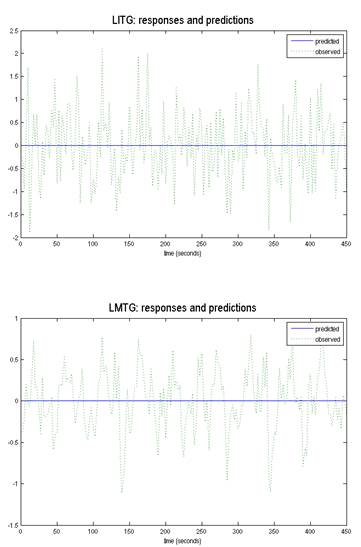
It is clear from this figure that the DCM hasn’t worked – it found that a flat line best explains your data. First, which version of SPM or DCM are you using?
*SPM8
The priors were changed a little while ago to make flat lining less probable – try using SPM12b if you’re not already.
*I can’t practically do this as we have used SPM8 for all the subjects pre processing and GLM analysis. So it would be in best reason to use SPM8 across complete project
Other than that, there are many reasons why it may not have worked. The most probable is the data in the VOIs themselves.
How did you select them?
*These VOI’s were selected based on T-values of a given ROI. So, for a given active cluster for a region, a VOI with highest T-value was selected for DCM model space. These were extracted as eigenvariates
of 5mm spheres and adjusted to F contrast-effect of interest
Were they regions which showed activity in a regular SPM analysis?
*Yes, these regions were active at p<0.001 uncorrected in GLM analysis
Best,
Peter.
From: Zeidman, Peter [mailto:[log in to unmask]]
Sent: Wednesday, October 08, 2014 1:04 PM
To: Kapse, Kushal Janardan;
[log in to unmask]
Subject: RE: DCM users
Hi Kushal,
Could you reply to the mailing list with answers to the questions I asked in my previous reply, below? This will help to diagnose the problem.
Best,
Peter.
From: Kapse, Kushal Janardan [mailto:[log in to unmask]]
Sent: 08 October 2014 18:01
To: Zeidman, Peter; [log in to unmask]
Subject: RE: DCM users
Hi Peter,
I have been trying to understand why the model I have been defining shows flat line and not the better fit to the observed and predicted. Is ther any way you can advise on things to track at VOI
level so that expect to have better model fit. The subjects are scanned on event related randomized experiment.

Please let me know
Thanks
KK
From: Zeidman, Peter [mailto:[log in to unmask]]
Sent: Monday, September 29, 2014 5:58 AM
To: Kapse, Kushal Janardan;
[log in to unmask]
Subject: RE: DCM users
Dear Kushal,
It is clear from this figure that the DCM hasn’t worked – it found that a flat line best explains your data. First, which version of SPM or DCM are you using? The priors were changed a little while ago to make
flat lining less probable – try using SPM12b if you’re not already.
Other than that, there are many reasons why it may not have worked. The most probable is the data in the VOIs themselves. How did you select them? Were they regions which showed activity in a regular SPM analysis?
Best,
Peter.
From: SPM (Statistical Parametric Mapping)
[mailto:[log in to unmask]]
On Behalf Of Kapse, Kushal Janardan
Sent: 25 September 2014 21:25
To: [log in to unmask]
Subject: [SPM] DCM users
Hi SPM/DCM users,
I am applying DCM to a set of data. As per my understanding the observed and predicted response should match the best. For the VOI’s I selected, the predicted shows as flat line across the observed
response. I am concern about this if how this will affect my models. If anyone can explain how to make this better, that would be really helpful
Thanks
Kushal