Hi Paul/Matt/FMRIB team,
I've updated to the new fsl version today (on macOS Big Sur) and noticed two issues thus far:
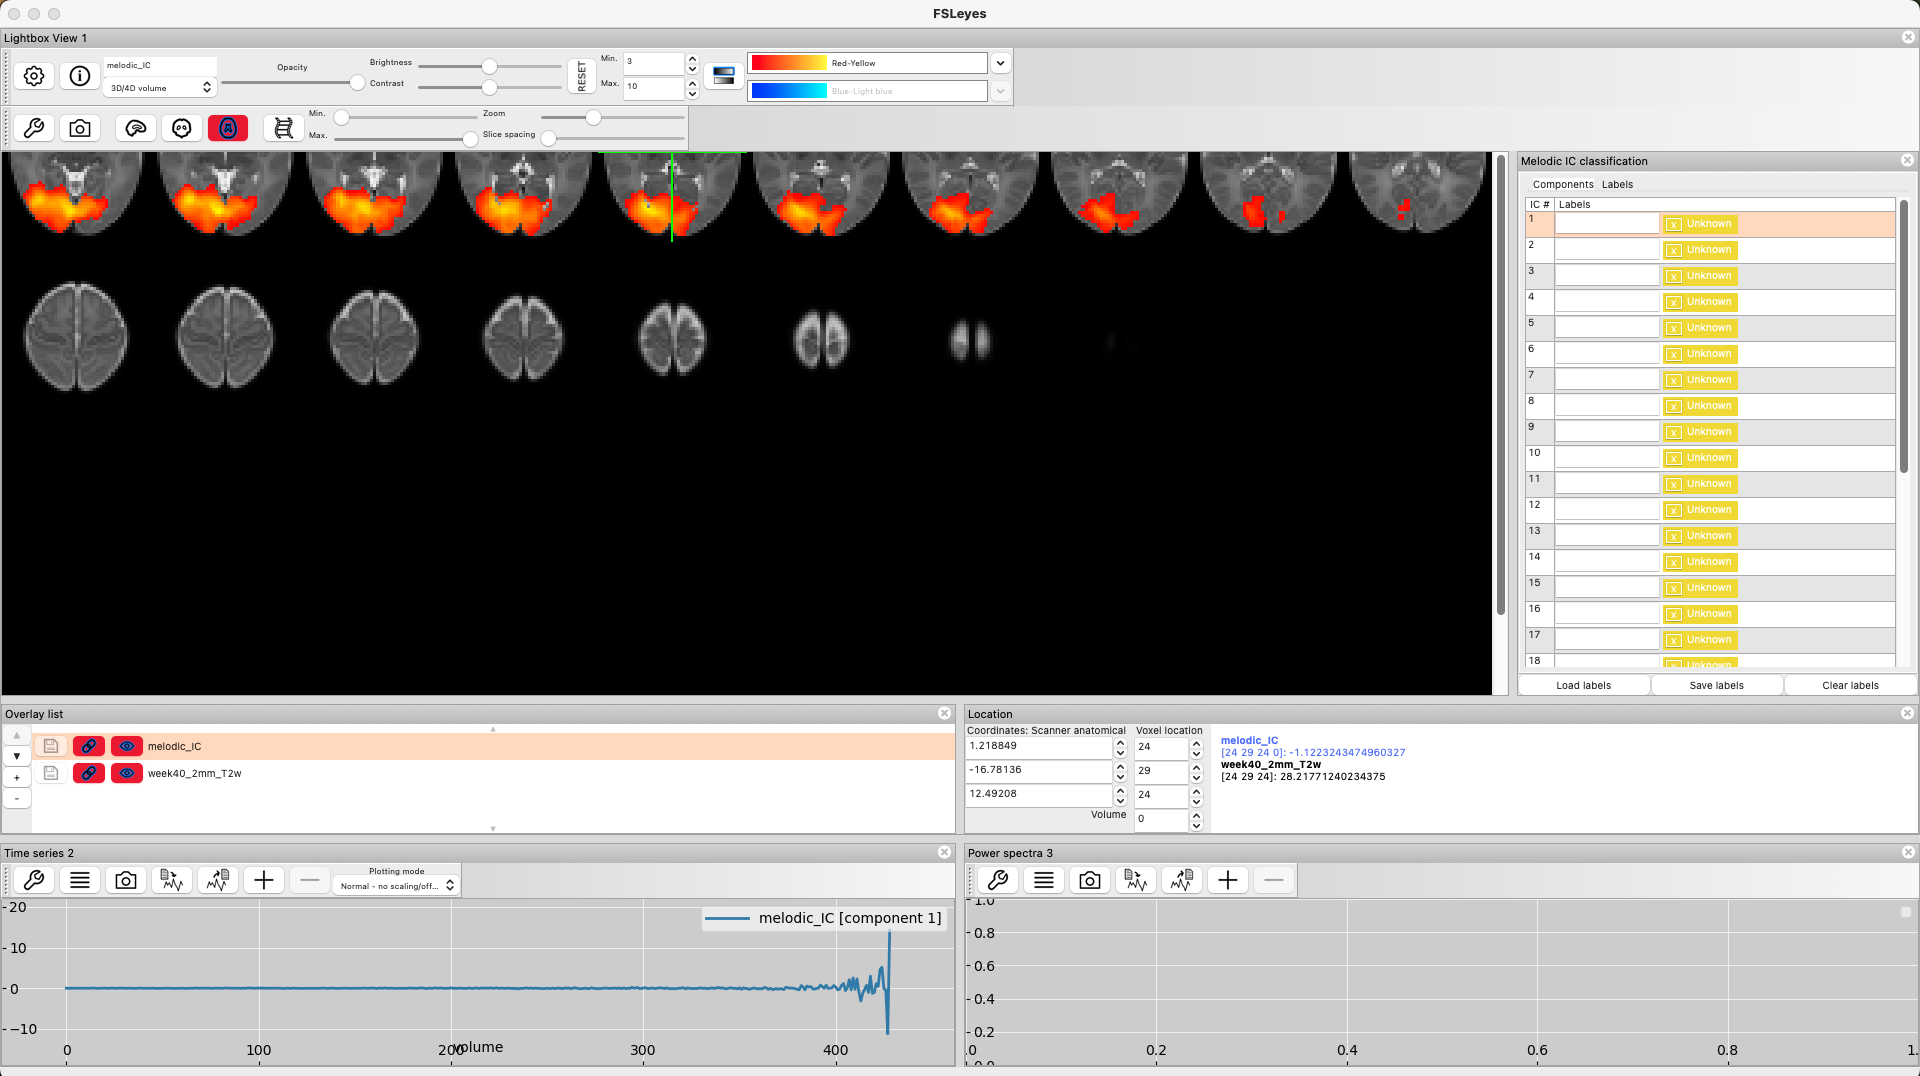
(1) image cut-offs are making the gui unusable for checking slices from any view
(2) there is no power spectra shown for my independent components from my group ICA
Image: https://drive.google.com/file/d/107gUAuCXvFkBmbcDJvYtInqcpsuZ3kWI/view?usp=sharing
If I may also query, related to the latter:
+ How does one load fsleyes -ad -s melodic melodic_IC.nii.gz with a background image instead of the mean (via CLI)?
+ How does one interpret the timeseries and power spectra at the group ICA level - I've heard this isn't reliable (with no expansion on this statement) and have also seen Paul's recent post in which he says the power spectra are read from the melodicFT file and not converted directly into frequencies. I'm trying to match the online guidance and the Griffanti paper to ensure my components are plausible, so it helps if I can trust the frequencies. Could you provide a little clarification or guidance with respect to both the timeseries and power spectra displays when in MELODIC mode please (especially if this has shifted across versions)?
Thanks,
Ryan
########################################################################
To unsubscribe from the FSL list, click the following link:
https://www.jiscmail.ac.uk/cgi-bin/WA-JISC.exe?SUBED1=FSL&A=1
This message was issued to members of www.jiscmail.ac.uk/FSL, a mailing list hosted by www.jiscmail.ac.uk, terms & conditions are available at https://www.jiscmail.ac.uk/policyandsecurity/
|


