|
Dear all,
Bernhard Rupp has just published a "Perspective" article in
Structure, accessible in electronic form at
https://www.cell.com/structure/fulltext/S0969-2126(18)30138-2
in which part of his general argument revolves around an example
(given as Figure 1) that he produced by means of the STARANISO server
at
http://staraniso.globalphasing.org/ .
The complete results of his submission to the server have been saved
and may be accessed at
http://staraniso.globalphasing.org/Gallery/Perspective01.html
and it is to these results that I would like to add some annotations
and comments. To help with this, I invite the reader to connect to
this URL, type "+" a couple of times to make the dots bigger, and
press/toggle "h" whenever detailed information on the display, or
selection of some elements, or the thresholds used for colour coding
the displays, needs to be consulted.
The main comment is that the WebGL interactive 3D display does
give information that makes visible characteristics that could hardly
be inferred from the very condensed information given in Table 1, and
the annotations will be in the form of a walk through the main
elements of this display.
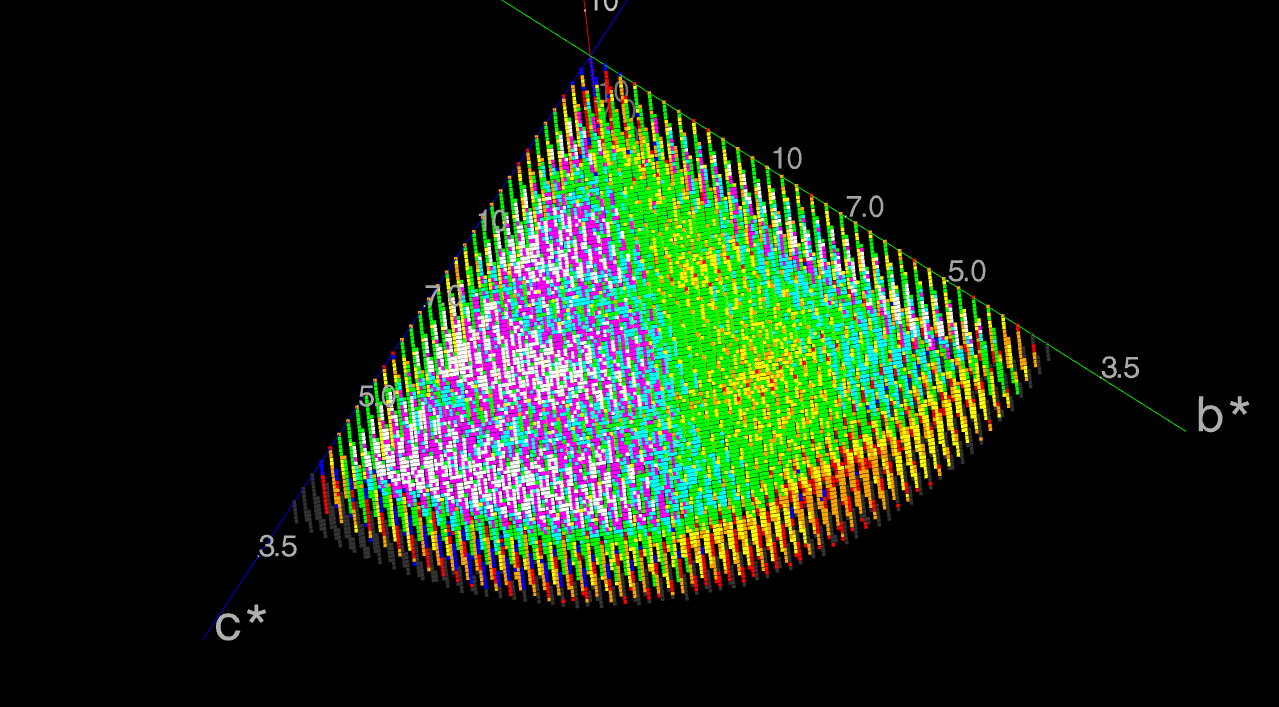
For instance the left-most graphical object (a static view of
which is attached as "Redundancy.png") shows the 3D distribution of
the redundancy (or multiplicity) of measurements. The view chosen for
the attached picture shows a strong non-uniformity in this redundancy,
with the region dominated by cyan/magenta/white having about twice the
redundancy (in the 6/7/8 range) of that which prevails in the region
dominated by green/yellow (in the 3/5 range). Clear concentric gashes
in both regions, with decreased redundancy, show the effects of the
inter-module gaps on the Pilatus 2M detector of the MASSIF-1 beamline.
The blue spherical cap along the a* axis corresponds to HKLs for which
no measurement is available: it is clearly created by the detector
being too far from the crystal.
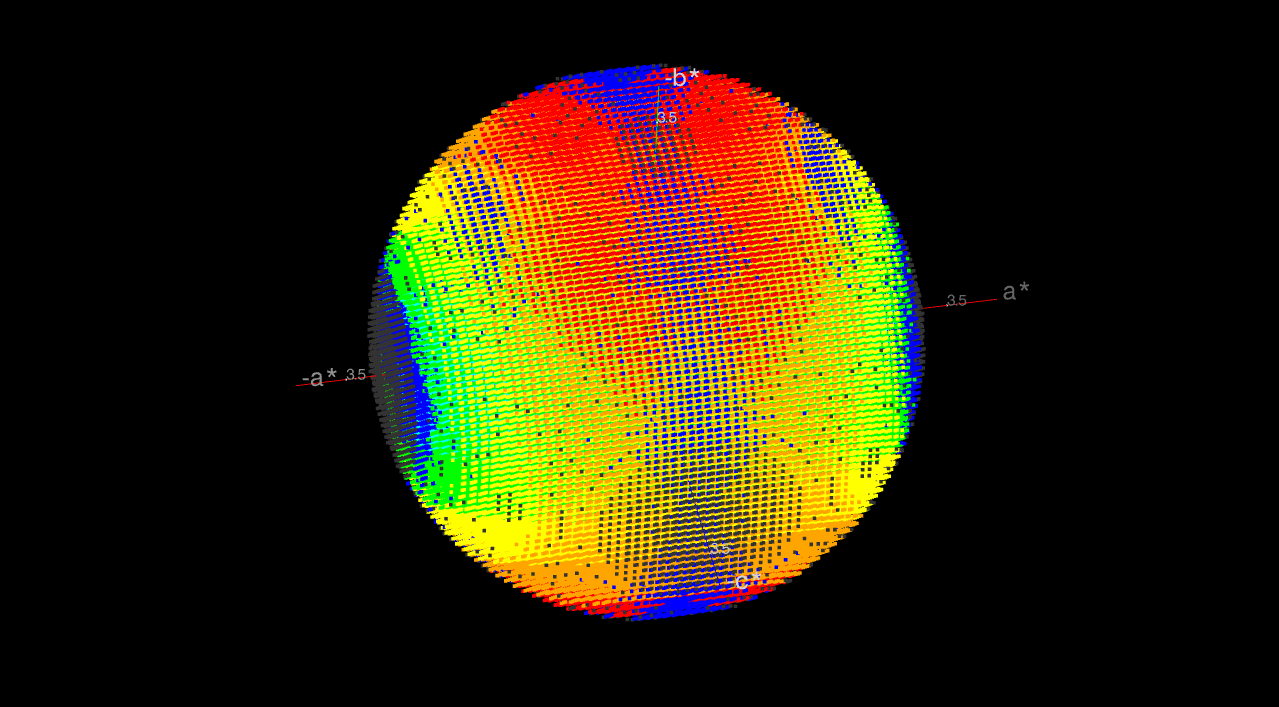
The second (central) graphical object, of which a view is given
in Figure 1 of Bernhard's article and another in the attached picture
"Local_I_over_sigI.png") shows vividly the blue cap of measurements
that were missed but would probably have been significant (had they
been measured) cutting into the green region, where the local average
of I/sig(I) ranges between 16 and 29! If the detector had been placed
closer, significant data extending to perhaps 3.0A resolution would
arguably have been measured from this sample.
The right-most graphical object (of which a static view is
attached as "Debye-Waller.png") depicts the distribution of the
anisotropic Debye-Waller factor (an anisotropic generalisation of the
Wilson B) of the dataset, giving yet another visual hint that good
data were truncated by the edges of a detector placed too far.
Apologies for such a long "STARANISO 101" tutorial but Bernhard's
invitation to lift our eyes from the terse numbers in Table 1 towards
3D illustrations of data quality criteria was irresistible ;-) . His
viewpoint also agrees with one of the main purposes of our STARANISO
developments (beyond the analysis and remediation of anisotropy, about
which one can - and probably will - argue endlessly) namely contribute
to facilitating a more direct and vivid perception by users of the
quality of their data (or lack of it) and to nurturing evidence-based
motivation to make whatever extra effort it takes to improve that
quality. In this case, the undeniable evidence of non-uniformity of
redundancy and of a detector placed too far would give immediate
practical guidance towards doing a better experiment, while statistics
in Table 1 for the same dataset would probably not ... .
Thank you Bernhard!
With best wishes,
Gerard,
for and on behalf of the STARANISO developers
########################################################################
To unsubscribe from the CCP4BB list, click the following link:
https://www.jiscmail.ac.uk/cgi-bin/webadmin?SUBED1=CCP4BB&A=1
|


