Esteemed SPM list,
I am having trouble making sense of two analysis results: whole brain vs ROI. A second level between-groups T test (patients and controls) of first level con images returns voxels in the regions that we predicted a priori, peak T value of around 7.0 and they survive at whole-brain FWE 0.05. So far so good! However, the beta values extracted from an anatomical ROI analysis of this region do not differ between groups using a t-test. Looking at the group means shows that this is because the standard deviation is very big in the patient group. So why are T values so big in SPM?
Two things I've tried to explore this:
1) Just to prove the point, I also fail to find group differences even if I circularly define my ROI as the significant cluster from the 2nd level between-groups T contrast image (the one that survives at FWE 0.05).
2) If I use SPM to plot the 'fitted response' of the peak voxel of the second level group T contrast, I get the individual values for each subject. (Are these T values? I read from another post that they are 'y values, calculated as beta multiplied by X'...)
Unsurprisingly, these differ between-groups when I run a t-test, but if I extract beta values of this peak voxel from each subject's 'con' image then I do not (same situation as above with ROI analysis).
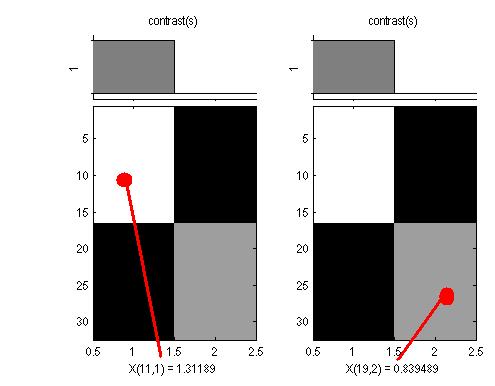
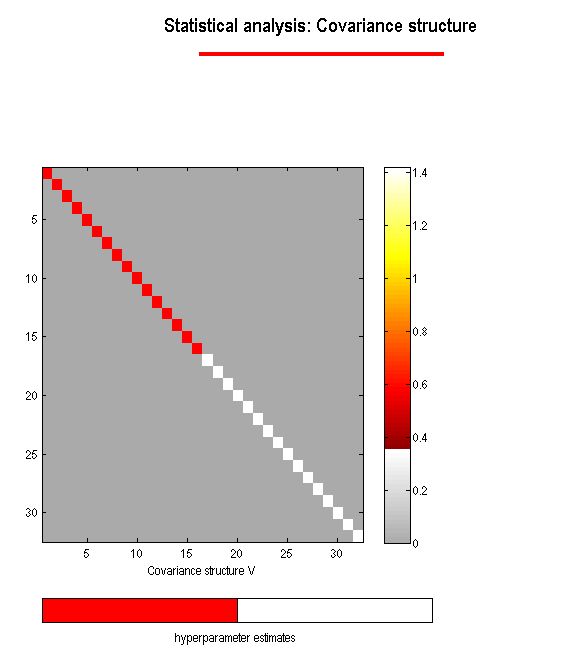
So it would seem that I have a situation where the two groups do not differ in beta value (either in my mean/median ROI or peak voxel) due to variance, but that the T values(?) calculated in SPM somehow take this into consideration. Does SPM scale the two groups (e.g. depending on whole brain variance)? When I view the design matrix visualisation and left click on each of the groups cells, the value differs - I would have expected that both groups would be 'weighted' equally (i.e. 1) but they differ (see screenshot)
Many thanks in advance for any advice on how to explore this further.
|


