Dear SPMers,
I just re-read my post and I realise that I didn't make it clear that all
activations are well within the glass brain and the wmT1.
The activations seem to be compressed several mm so that you get a halo of
clear space around the group functional data and when you check reg the
functional data falls way short of the edge of my wmT1.
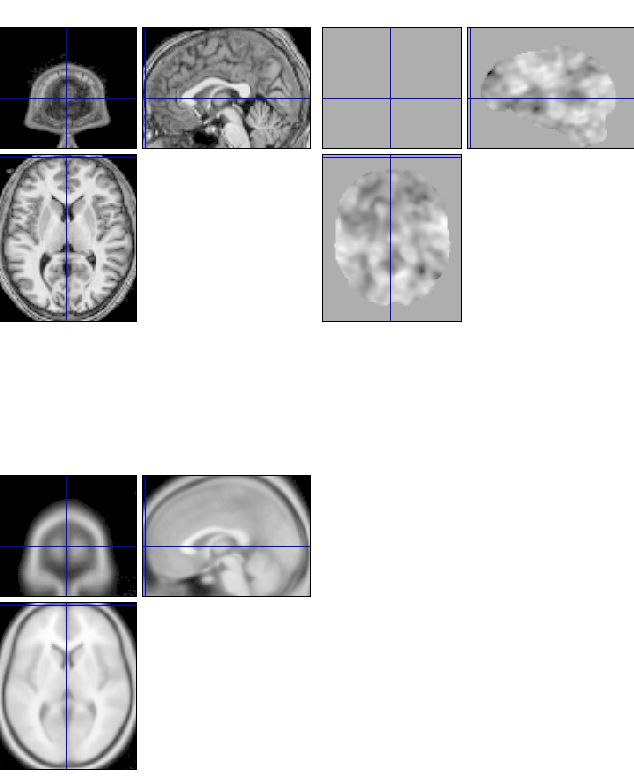
I have attached a JPEG of the check reg (top left: my averaged wmT1, top
right: my group functional data, bottom left: SPM 152T1 template) and a
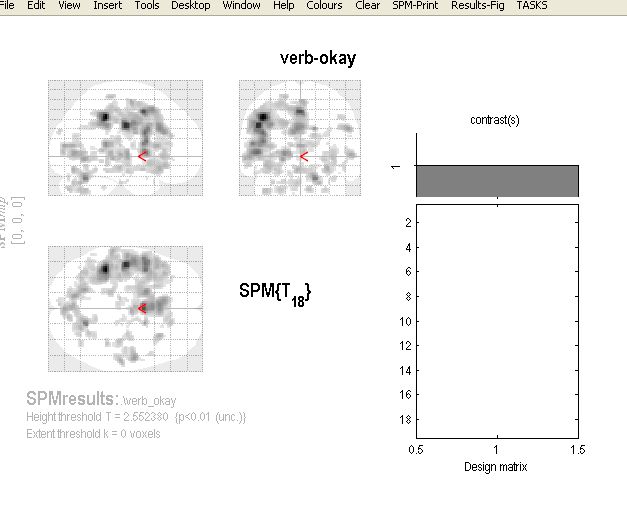
JPEG of a group glass brain. My concern is that the functional data is not
reaching the edge of my wmT1, template or filling the glass brain.
------------------------------------
I have a slight problem with a random-effects group analysis and wonder
if you might be able to help.
Essentially my concern is that the group activations (as shown by an SPMT
image for one particular contrast) do not line up with the outer edge of
cortex in my averaged wmT1 or the SPM single-subject canonical template.
This is the case for all group T images.
Individual subject normalisation was accurate as verified visually using
check reg - both individual structural and mean functional images match
the T1 template and wmT1 accurately. The problem seems to arise when I do
a group analysis.
Is there a stage of processing I have done erroneously?
Thank you in advance,
Rachel
|


